
 AI Tools
 Health
 Math
Math Everyday Life
 Finance
 Physics
 Chemistry
 Statistics
 Construction
 Pets
Pets Time & Date
 Conversion Calculator
 Sign In
Follow Us On:
Follow Us On:
Enter all the required values in their respective fields, and the calculator will draw a Venn diagram, with the steps displayed
Related
The probability Venn diagram calculator generates the symmetric Venn diagram of two or three sets of data. Not only this, but you can also get union and intersection results for given values by using this Venn diagram solver.
The Venn diagram is a basic representation of all the similarities and differences of the set of data.
The other name of the Venn diagram is the logic diagram and it represents all the possible logical possibilities or probabilities. In set mathematics, it is the most efficient model to represent the relationship between the sets of data by a simple graphical representation. The similarities are the intersection values and the differences are the unions of dataset values. You may not get to know how to figure out union and intersection numbers in data set groups. But do not worry as our Venn diagram calculator will do it for you in seconds.
n (A ∪B) = n (A) + n(B) - n (A ∩ B)
n ( A∪ B ∪ C) = n(A) + n(B) + n(C) - n( B∩ Y) - n( B ∩ C) - n ( C ∩ XA) + n( A ∩ B ∩ C)
Our Venn diagram probability calculator also makes use of the above-mentioned formulas to generate accurate outcomes in a glimpse of moments.
In a university, 200 students are randomly selected. Now 140 students like football, 120 like cricket, and 80 like both football and cricket.
Here set A represents the students who like football set B the students who like cricket, and the intersection of A∩B, the students who like both football and cricket.
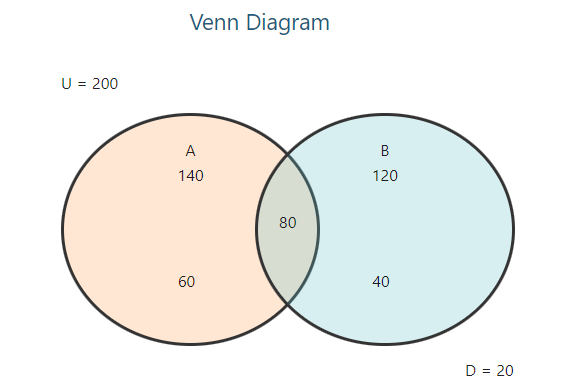
The 3 circle Venn diagram template elaborates that the students only like football or cricket with the students like both the game.
The Students Like Only the Football:
A-only = A - A∩B
A-only = 140-80
A only = 60
The Students Like Only the Cricket:
B-only = B - A∩B
B-only = 120-80
B-only = 40
Students Like Both Football and Cricket
A= 140 B = 120 A∩B = 80
Students Like Neither Football Nor Cricket:
D = U - [A only + B only + (A∩B)]
D = 200 - [(60) + (40) + 80]
D = 20
The 3 Venn diagram picture also represents the students neither like cricket nor football.
Our probability Venn diagram solver requires a few values to calculate the results.
These include:
The 3 circle Venn diagram template is called the triple Venn diagram. The triple Venn diagram maker is used to compare three categories. The overlapping region represents the shared region between the three categories.
The intersection is the HCF (highest common factor) and the union is the LCM (Least common multiple) in the Venn diagram. The Venn diagram calculator calculates both the LCM and HCF of the 2 and 3 sets.
From Wikipedia: Venn diagram, triple circle diagrams
From Investopedia: Venn diagram components
Related
Add this calculator to your site.
×Just copy a given code & paste it right now into your website HTML (source) for suitable page.
Preview:



Easter into Action, Save With Satisfaction
UPTO
50 %
OFF
Give Us Your Feedback
Share Result
Venn Diagram Calculator

Links
Home Conversion Calculator About Calculator Online Blog Hire Us Knowledge Base Sitemap Sitemap TwoEmail us at
Contact Us© Copyrights 2026 by Calculator-Online.net
How was your experience today?
Not now
Awesome! Would you mind sharing that on Trustpilot?
Your review helps others find a tool that actually works.
Write a Review on TrustpilotNot now
Sorry to hear that
Tell us what went wrong — we read every message.
Not now
Thanks for your feedback!
We'll use it to make things better.
